The finishing time is the most recorded and least understood number in UK greyhound racing. Every result card prints it. Every racecard shows a dog’s recent times. Every punter glances at them. But remarkably few punters understand what those times actually measure, what affects them, and when they are a reliable indicator of form versus when they are misleading. A dog that runs 29.50 at Romford and a dog that runs 29.50 at Towcester have done two completely different things. The number is the same. The performances are not comparable. Until you understand why, finishing times will tell you less than they should about the race that just happened and the race that is about to. Get more race analysis at dogracingresultstoday.
This guide breaks down how UK greyhound finishing times work — how they are measured, what variables affect them, how to use them as a form tool, and when to ignore them entirely. The goal is to turn the most visible number in greyhound results from a superficial data point into a useful analytical input.
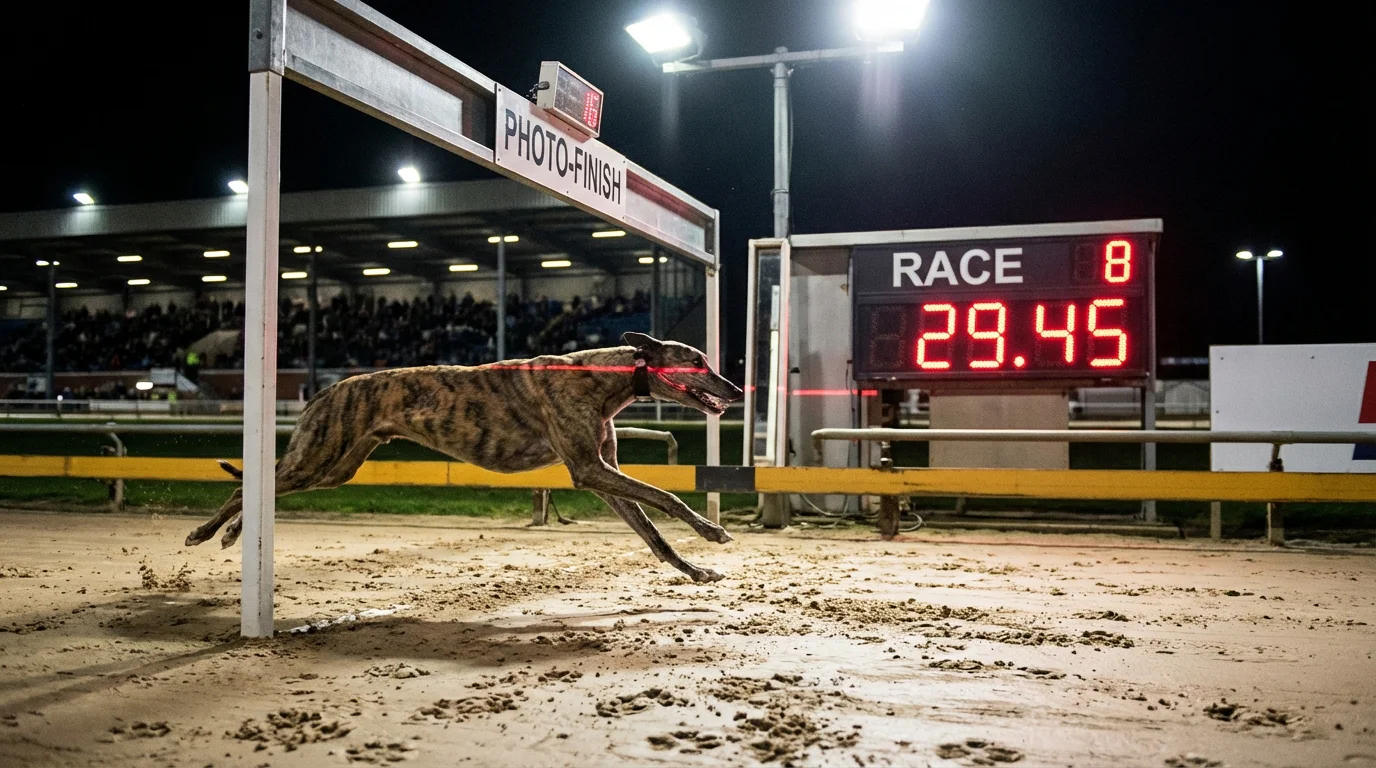
How Greyhound Finishing Times Are Measured and Recorded
UK greyhound finishing times are measured electronically from the moment the traps open to the moment the winning dog’s nose crosses the finish line. The timing system is triggered by the trap mechanism and stopped by a photo-finish camera and beam system at the finish. Times are recorded to two decimal places — hundredths of a second — and published as part of the official result.
The time shown on the result card is the winner’s time. Second and third-place times are sometimes published (particularly on more detailed results services like Timeform) but are not always available. When they are, the gap between the winner’s time and the placed dogs’ times gives you a precise measure of the winning margin, which is a valuable form indicator. A dog that wins by three lengths in 29.45 has done something different from a dog that wins by a short head in 29.45 — the first was clear; the second was in a battle.
Sectional times — splits measured at intermediate points around the track, typically to the first bend and sometimes at additional checkpoints — are recorded at some UK tracks and published by Timeform. These are analytically more valuable than the overall finishing time because they reveal how the race was run. A dog with a fast first-bend split and a slower second half is a front-runner that faded. A dog with a slower first split and a fast closing section is a closer that ran on. The finishing time alone does not distinguish between these two running styles, but the sectionals do.
What Affects Finishing Times: Weather, Track Condition and Grade
Finishing times are not produced in a vacuum. They are the product of the dog’s ability, the track conditions on the night, and the competitive context of the race. Comparing a time from a dry summer evening with a time from a wet winter card is comparing apples with gravel. The track surface — sand at all UK tracks — runs differently depending on moisture content, temperature, and maintenance. Wet sand is heavier and slower. Dry, well-maintained sand produces faster times. The going can change during a single meeting if rain arrives mid-card.
Track configuration also affects times. Each UK venue has different dimensions — circuit length, bend radius, straight length — and these produce different typical time ranges for the same distance. A 400-metre race at Romford, which is a tight track with sharp bends, produces different times from a 480-metre race at Monmore, which has wider bends and different geometry. The times are not directly comparable, and any analysis that treats them as interchangeable is fundamentally flawed.
The grade of the race matters too. Dogs in A1 races are faster than dogs in A5 races at the same track over the same distance. This is self-evident, but the implication is that a 29.80 in an A1 race represents a higher level of performance than a 29.80 in an A5 race, because the A1 dog achieved that time against faster opponents in a more competitively run race. The time without the grade context is an incomplete data point.
Finally, the hare — the mechanical lure — affects sectional patterns and, by extension, overall times. Variations in hare speed and position can produce differences in how dogs break from the traps and run the first bend. These variations are small but not negligible, and they contribute to the session-by-session fluctuation in times that makes single-race times unreliable as absolute benchmarks.
Using Times as a Form Tool: PB vs Actual Time
A dog’s personal best (PB) is the fastest finishing time it has recorded at a given track over a given distance. Racecards often display the PB alongside recent times, and many punters treat it as a ceiling — the best the dog can do. This interpretation is partly correct and partly misleading. The PB was set on a specific day under specific conditions. It may have been run on a fast track in dry summer conditions with a strong pace set by the leader. Expecting the dog to reproduce that time in November on a rain-affected surface is unreasonable.
The more useful comparison is between the dog’s recent actual times and the track’s average time for its grade and distance. If the average winning time in A3 races at Monmore over 480 metres is 29.70, and your dog has run 29.65 and 29.72 in its last two A3 runs at the same track, it is performing at or above the grade standard. If it has run 30.10 and 30.05, it is underperforming the grade and may be heading for a demotion. This relative comparison is far more informative than comparing against the PB.
Tracking time trends is another practical use. A dog that has run 29.90, 29.80, 29.75, 29.70 across four consecutive runs at the same track and grade is improving — the times are coming down, which suggests increasing fitness or sharpness. A dog showing the reverse trend — 29.70, 29.80, 29.90, 30.00 — is declining, and the times confirm what the finishing positions may or may not show. Time trends are a leading indicator: they often signal a change in form before the finishing positions catch up.
Comparing Times Across Different UK Tracks
Cross-track time comparison is one of the most common analytical errors in greyhound betting. A dog that runs 29.40 at Romford and 29.70 at Towcester has not slowed down. It has run on two different tracks with different dimensions, surfaces, and competitive contexts. Direct comparison of the raw numbers is meaningless.
To compare performances across tracks, you need a conversion method. The simplest approach is to compare each dog’s time against the average winning time at that track for the same distance and grade. If Dog A ran 0.30 seconds faster than the A3 average at Romford, and Dog B ran 0.25 seconds faster than the A3 average at Towcester, Dog A’s performance was marginally stronger relative to its field. This adjusted comparison is imperfect — it does not account for the different calibre of dogs at different tracks — but it is vastly more reliable than comparing raw times.
Timeform ratings provide a more sophisticated solution. Their rating system incorporates track, distance, grade, and conditions into a single number that is designed to be comparable across venues. A Timeform rating of 80 achieved at Romford represents the same assessed ability as a rating of 80 achieved at Towcester, because the system has already adjusted for the track-specific factors that make raw times incomparable. For bettors who follow dogs across multiple tracks — particularly for open races and special events — Timeform ratings are the most practical tool for cross-venue assessment.
When Times Signal a Step Forward or a Step Back
The most actionable use of finishing times is identifying inflection points — moments when a dog’s performance shifts meaningfully upward or downward. A dog that has been running 30.00-30.10 for three months and suddenly records 29.70 has taken a step forward. The question is why. If the track was running fast that evening (check whether other dogs also posted quick times), the improvement may be environmental rather than genuine. If the track was running at a normal pace and the dog still posted a fast time, the improvement is more likely to be real — perhaps a response to a grade drop, a new distance, or simply a natural maturation in a young dog.
Conversely, a dog that has been consistently running sub-29.80 and posts 30.20 has either encountered problems during the race (checked at the first bend, squeezed for room on the back straight) or is showing signs of physical decline. The result comment — published by Timeform on most races — will often explain the in-race circumstances. If the slow time has a clear tactical explanation, it can be discounted. If the dog ran cleanly and still posted a slow time, the signal is more concerning. Also explore our UK greyhound track statistics.
The punters who use times most effectively treat each new time not as an isolated number but as a point on a curve. Three or four times in sequence, at the same track and distance, in the same grade range, plotted over a few weeks — that is a trajectory. And trajectories, unlike single data points, predict. A dog trending faster is likely to continue trending faster until it reaches its ceiling or its conditions change. A dog trending slower is likely to continue trending slower until the racing manager drops it to a lower grade. The time is just a number. The trend is the signal.